- A
- A
- A
- ABC
- ABC
- ABC
- А
- А
- А
- А
- А
The Sawtoothed Marriage Curve
© WIKIMEDIA COMMONS
The marriage rate goes through both seasonal and annual fluctuations. In many countries, fewer people marry during leap years. Demographer Eugeny Soroko analysed this phenomenon in a report prepared for the XX International Academic Conference on Economic and Social Development hosted by the Higher School of Economics.
Demographic processes are subject to fluctuations. The ‘seasonality’ of mortality rates, for example, is a known phenomenon. With regard to marriages, traditions play a role (as seen in how common it is for people to hold wedding ceremonies), as does the degree of religiosity (it is not customary to marry during the fast), as well as fashion (an increasing number of couples marry on Valentine’s Day), and so on.
At the same time, marriage rates are subject to annual fluctuations that the size of consecutive generations or socio-economic trends do not explain. A number of countries, including Belarus, experience four-year cycles in that rate. HSE Institute of Demography Senior Research Fellow Eugeny Soroko studied this phenomenon in a host of other countries as well, including Russia, Greece, and Ukraine.
The report is based on data from industrialised countries’ national statistics services, as well as data from Russia’s State Statistics Service for 1990-2017, and data that Russian regions post data to the Demoskop Weekly demographics site. The report uses the overall marriage rate (marriages per 1,000 people per year) as its main indicator.
The Leap Year Lull
To illustrate the situation, the researcher compared the marriage dynamics of three countries: Greece, Norway, and Ukraine (Fig. 1). In Norway, the curve is generally smooth, without sharp fluctuations, but the situation is different in Ukraine and Greece. There, the number of marriages drops dramatically during leap years, but rises in the years just before or after leap years. ‘The curve’s dynamics take on a pronounced sawtoothed shape,’ notes Eugeny Soroko. He explains:
![]() In Greece, deviations in the marriage rate reach an average magnitude of 10-20% over four years, taking multiyear trends into account.
In Greece, deviations in the marriage rate reach an average magnitude of 10-20% over four years, taking multiyear trends into account.
![]() Although the sawtoothed curves for Ukraine and Greece differ in absolute terms, they display a synchronised deviation by year in both direction and magnitude.
Although the sawtoothed curves for Ukraine and Greece differ in absolute terms, they display a synchronised deviation by year in both direction and magnitude.
![]() Of the 41 industrialised countries studied, the greatest annual deviations occurred in countries with a large proportion of Russian Orthodox believers (with the numbers deviating in direct proportion to the relative size of the population).
Of the 41 industrialised countries studied, the greatest annual deviations occurred in countries with a large proportion of Russian Orthodox believers (with the numbers deviating in direct proportion to the relative size of the population).
![]() The marriage rate is slightly higher in the year prior to the leap year than the one following.
The marriage rate is slightly higher in the year prior to the leap year than the one following.
According to Soroko, the Russian regions display a similar pattern (Fig. 2). Apparently, the scale of those deviations is also closely related to the proportion of Orthodox believers there.
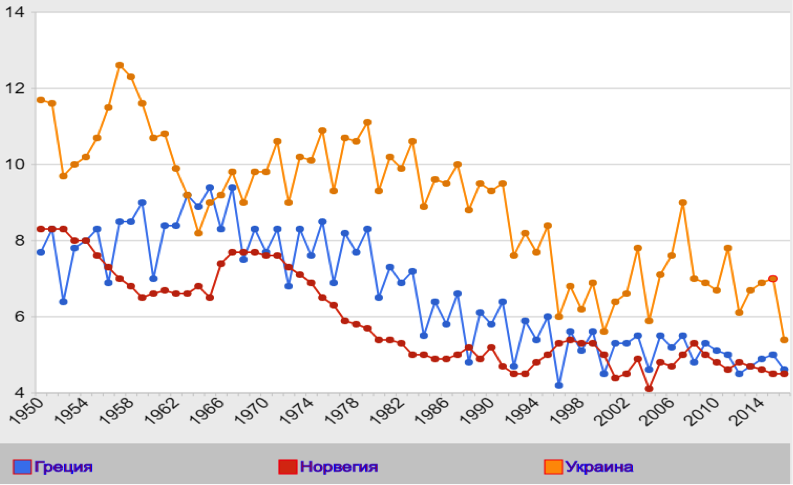
Figure 1. Overall marriage rate,
Greece, Norway, Ukraine, 1950-2016, ‰*
Regional Contrasts
In Dagestan, where the Russian Orthodox population is significantly smaller, no sawtoothed deviations in the marriage rate were observed. By contrast, the marriage curves for Russia’s European regions display the synchronised sawtoothed deviations associated with the leap year.
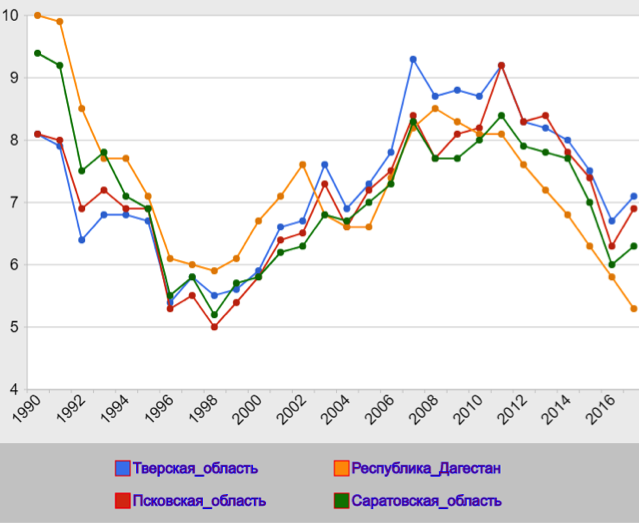
Figure 2. Overall marriage rate,
Tver, Pskov, Saratov region,
Republic of Dagestan, 1950-2017, ‰*
Fewer Marriages
Eugeny Soroko calculated the number of people who avoid marrying during a leap year in five countries: Russia, Greece, Ukraine, Belarus and Moldova (Table 1). For four of those countries, he looked at 15 leap years, from 1956 to 2012, and for Russia, at 13 leap years, starting from 1964. The indicator was the relative share of the population that did not register to marry in relation to the average expected number of marriages (excluding leap years). The righthand column of Table 1 shows the ‘average decrease in the marriage rate during leap years),’explained Eugeny Soroko. Each of the countries he analysed experienced a decrease in marriages during leap years, and all have significant Orthodox populations.
|
Country |
Decrease in marriage rate during leap years |
|
Greece |
-11,6 |
|
Ukraine |
-8,7 |
|
Belarus |
-5,2 |
|
Russia |
-4,7 |
|
Moldova |
-3,2 |
Table 1. Decrease in the marriage rate during leap years, Greece,
Ukraine, Belarus, Moldova, 1956-2012,
Russia — 1964-2012, ‰*
Local Fluctuations
Soroko studied changes in marriage rates for 77 Russian regions over four-year periods, with leap years falling in the middle. The findings for 1994-1998 (Fig. 3) speak volumes.
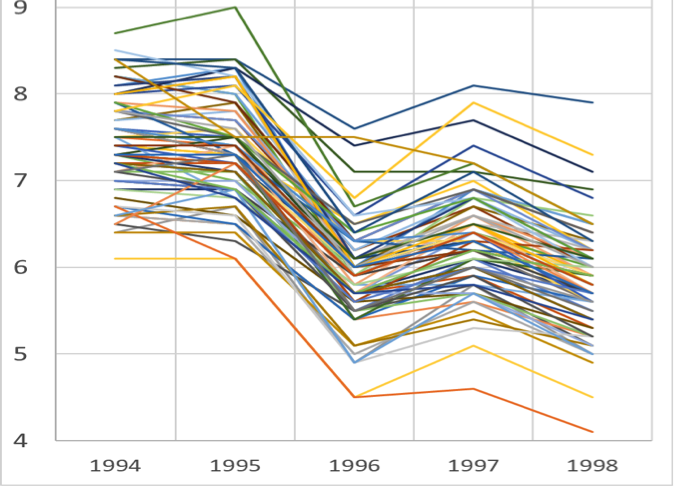
Figure 3. Overall marriage rate,
77 Russian regions, 1994-1998, ‰ per year*
For the following reasons, however, such data are not necessarily best for measuring the effect of leap years on marriage rates:
![]() The evolution of the age-sex structure of the eligible population or socio-economic disasters can affect marriage trends within the four-year periods.
The evolution of the age-sex structure of the eligible population or socio-economic disasters can affect marriage trends within the four-year periods.
![]() The marriage rates of many regions can vary significantly due to differences in, for example, the age and ethnicity of their populations.
The marriage rates of many regions can vary significantly due to differences in, for example, the age and ethnicity of their populations.
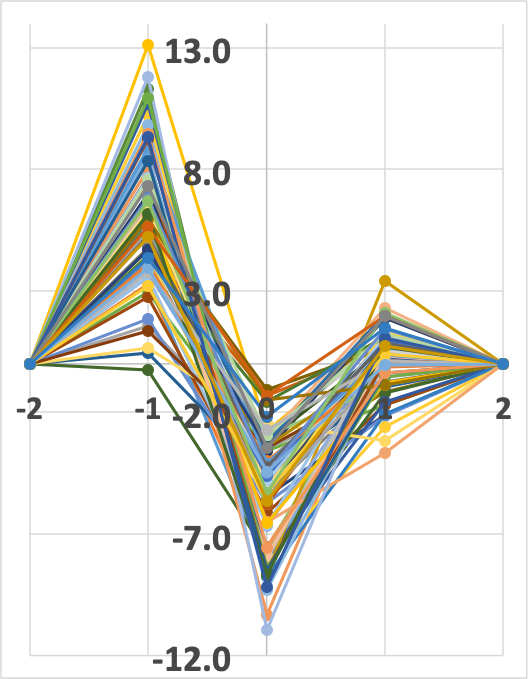
![]() To eliminate influence by these factors, it is necessary to take a given region’s marriage trends over a four-year period into account, and then compare those to relative indicators. If data are available for more than one leap year, these indicators are averaged for the corresponding leap year [-2, +2] periods. The results for Russia’s regions are shown in the upper panel of Figure 4.
To eliminate influence by these factors, it is necessary to take a given region’s marriage trends over a four-year period into account, and then compare those to relative indicators. If data are available for more than one leap year, these indicators are averaged for the corresponding leap year [-2, +2] periods. The results for Russia’s regions are shown in the upper panel of Figure 4.
.png)
Figure 4. Deviation of the overall marriage rate
as a % of the level of the local four-year trend,
six leap years from 1990-2014,
± 2 from the leap year.
77 regions of Russia (upper panel),
Russia as a whole (lower panel) *
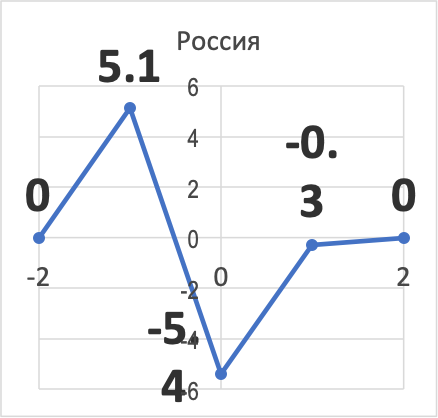
As the graph for Russia as a whole shows (lower panel of Fig. 4), marriage rates fall by more than 5% during leap years, while the rate increases by approximately as much in the year before a leap year (due to the marriages concluded a year earlier).
To what extent are the fluctuations surrounding a leap year synchronous? ‘As the marriage statistics for the last six leap years show, the rate drops in all 77 regions of Russia,’ said Soroko. ‘In the year before the leap year, the rate rose in 76 regions (with the exception of Moscow). In the year following the leap year, 53 of the 77 regions experience an increase.’
Possible Explanations
Many ethnic and religious groups have their own provisions regarding marriage. The Russian Orthodox community, for example, believes that marriages concluded during a leap year are less successful and enduring. To lower that risk, Orthodox couples either ‘speed up’ their weddings by a year, or postpone them until after the leap year. But is it possible to determine with certainty whether the observed dynamic is the result of the proportion of Russian Orthodox believers in a given population? ‘Unfortunately, no,’ said Eugeny Soroko, ‘because the census does not ask about religious beliefs. However, the contrast between various regions speaks for itself. For example, in Belgorod and Arkhangelsk—regions that experience a more than 10% drop in marriages during leap years—more than 97% of the population consists of peoples who are primarily Orthodox (Russians, Ukrainians, Belarusians, Greeks). In the Republic of Dagestan, however, where those ethnicities make up less than 4% of the population, the marriage rate drops by only 2.5% during leap years.
This observation is consistent with the situation in other countries as well. Wherever the Orthodox population is numerically insignificant, the phenomenon is practically non-existent, Soroko said.
* Source: Report by E.L. Soroko
Study author:
![]()