© Wikimedia Commons
Question: Many people assume that in the financial world everything is determined by emotions, coincidence or good luck. Can one expect at some point in the future to come up with precise laws describing, for example, the process of trading on the stock exchange? And also, how much trade is being affected by changes in the technologies and rules under which trading platforms operate ?
Conclusion: On large sets of financial data (for example, regarding transaction size for different securities), economists have indeed found certain patterns. However, differences in trade rules, technological aspects and institutional features explain only a small part of the vast spectrum of differences between these variables for different equities.
Professor of the Russian New Economic School (NES), Anna Obizhaeva together with colleagues from Maryland University and US the Federal Reserve System analysed detailed data (tick-by-tick) about transactions on the American stock market for 1993-2014. The economists found that there is a seemingly invisible internal structure in stock exchange trading, which is particularly noticeable in pre-2001 data.
However, due to the decimalization of the minimum price step (tick size), equated to one cent, greater fragmentation of orders, and the development of algorithmic trading technologies, this structure became more difficult to distinguish in observed transactions, although it probably survived at the meta-level orders (real large requests for the sale or purchase of assets).
An article about the study was published in the Journal of Financial Markets and continues a series of papers by Anna Obizhaeva on the theory of invariance of financial markets.
Tick is defined as the minimum step of a share price change from transaction to transaction. Since decimalization in 2001—the conversion of stock price recording from fractional to decimal—the tick has been 1 cent on the US stock market.
In natural sciences, such as physics, there are many equations and clear relationships between physical quantities. For example, Albert Einstein’s famous formula E = mc2, which expresses the concept of equivalence of a body’s mass and energy. It is generally believed that it is not possible to formulate such laws in social sciences, but scientists today refute this point of view.
Modern economists' research increasingly supports the hypothesis that financial data can exhibit certain robust patterns. And with their help, at least in the first place, one can describe what is happening in the financial markets with precise laws.
To analyse stock exchange trading, such as the American NYSE or NASDAQ, professors Anna Obizhaeva and Albert Kyle developed the theory of invariance of the market’s microstructure. Market microstructure studies examine liquidity issues, and invariance involves looking for robust patterns or constants in trade data.
In a simplified form, financial markets are described as follows: there are players in the market – they are institutional investors. They have portfolios consisting of a set of positions in different securities. Each security involves a real asset with a certain fundamental risk. The exchange of securities and transfer of risk between investors arises as a result of trading on the exchange. Of course, this service involves a fee which has to be paid. This fee is not just the traditional transaction cost or dealers’ commissions. The measure of the risk transfer is liquidity, which also determines the speed of the turnover of securities into cash.
Every risk transfer on the market can be called a ‘bet. According to Obizhaeva and Kyle, ‘bets’ are not measured in regular calendar time, but in business time—this reflects the actual time at which events take place on the markets. The rate at which business time flows is determined by the number of ‘bets’ entering the market. For some securities, ‘bets’ appear often and in significant numbers—business time for them flows quickly, so these are regarded as highly liquid assets. For other securities ‘bets’ are generally smaller and rarer—such assets have low liquidity.
The question is how liquidity can be measured and managed. This problem was particularly acute for investors and states during the 2008-2009 financial crisis, when the market was swamped with illiquid assets and billions of dollars had to be issued to save their owners— the largest investment banks. A study of the microstructure of the markets made it possible to answer these questions and, in some cases, effectively assess and prevent systemic risks (see section Why is it needed?).
Microstructural analysis involves working with large quantities of data over long periods of time. These data include detailed information on price movements, spreads, market depths, transaction size and a number of other indicators.
Sprea d is the difference between the best prices on orders to sell (ask) and orders to purchase (bid) at the same time for an asset.
For example, one can study the distribution of transaction size as a percentage of the total daily trading volume. This indicator varies greatly from market to market. In liquid markets, transactions are large; in illiquid markets, they are small. But how does one formulate a precise law to describe this diversity?
To achieve this, according to the theory of the invariance of the market microstructure, it is necessary to change from calendar time to business time – the time in which events take place in the markets.
As previously observed, many events take place in the liquid securities market, and time passes much faster than in illiquid markets. If one adjusts the trading volume to reflect the difference in the speed of business time in each market and analyses the distribution of transaction size as a percentage of trading volume, one can see that these distributions become relatively constant.
In her new study, Anna Obizhaeva and her colleagues did a massive amount of work: over 50 billion observations, extracted from the 1993-2014 Trades and Quotes (TAQ) database, were analysed. This database contains all information regarding transactions, deals and quotes for all shares listed on US exchanges during this period. For each transaction, the database contains the time, site name, company name, number of shares sold, strike price, deal terms and a number of other parameters.
The number of observations in the sample increases exponentially over time, from 5 million transactions per month in the US stock market in 1993 to 400 million per month in 2014.
The results of the study were quite diverse. However, an overall view of the findings is most easily obtained by comparing the two sets of graphs below.
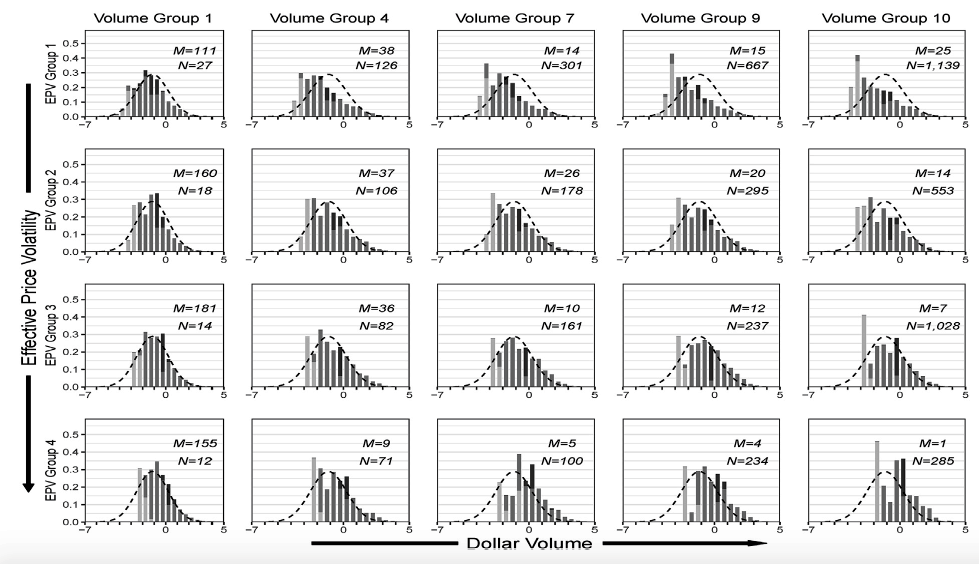
Above one can see logarithms of transaction size adjusted for differences in business time. They are calculated for the millions of transactions that occurred on the NYSE stock exchange in April 1993. All observations are divided into ten groups according to the total volume of trades (from small companies on the left to large ones on the right) and five groups on volatility (from small volatility at the top to large at the bottom).
It is clear that all the distributions are very similar to each other and also to the general normal distribution indicated by the dotted line. Thus one can see the existence of a hidden, consistent internal structure in the dynamics of the financial data, invisible to the untrained eye.
In addition, on the left, all the distributions are cut off by some thresholds marked with light-grey spikes—these observations correspond to the minimum lot size. In the United States, this threshold is 100 shares for almost all securities, meaning that market participants can not usually trade bids smaller than that number of shares. Clearly, such a rule imposes a restriction on the natural course of the bidding process and leads to distortions in the distribution of transaction size, which would most likely be observed in unrestricted markets.
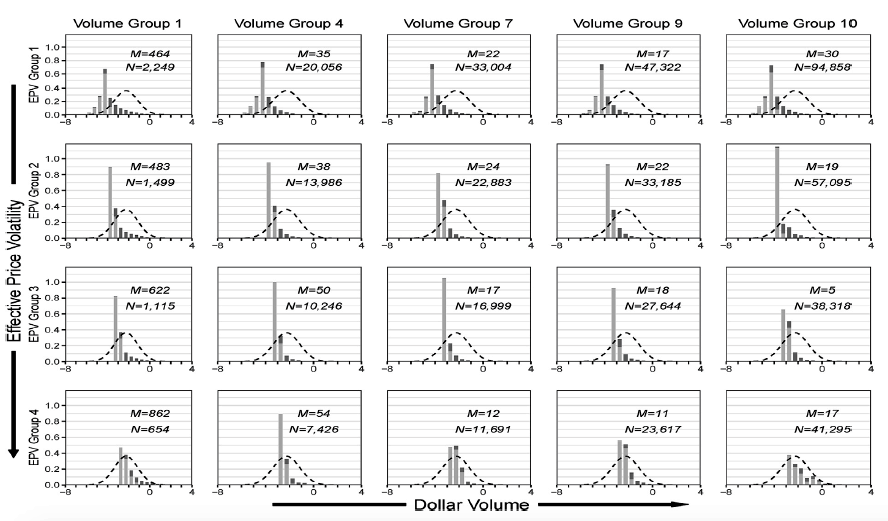
The next set of graphs shows a different picture. A similar analysis of the data is presented here, but for April 2014. One can see that all the distributions of scaled transaction sizes have become very different, and no longer show the previously observed earlier invariance—the general form approaching normal distribution. Almost all transactions in the US stock market during this period were exactly 100 shares.
The main reason for the observed changes is that, from 2001 to 2014, due to decimalisation, the US stock market saw a significant reduction in the minimum price step, as well as an increase in the use of electronic systems and algorithmic trading.
As a result, in order to optimise costs, traders began to break their meta-orders (initial trade ideas to sell or buy a certain, often quite large, number of shares) and execute them not in the form of a single large transaction, but through a series of small transactions with the smallest possible size.
These changes in microstructure mean that all variability in transaction sizes has disappeared. Therefore, during this period, although precise laws are likely to continue to apply for meta-orders, they become indistinguishable using the available transaction data.
The results of the study can be summarised as follows. Invariance theory explains almost 90% of the differences in the distribution of transaction size between different US shares. All the other effects, such as breakdown of meta-orders, specific roles of financial intermediaries and market makers in the trade process, along with other market imperfections, explain only the remaining 10%.
Use of the theory of invariance of the microstructure of the market makes it possible both to explain the occurrence of such crises as for example the sharp devaluation of the Russian ruble in 2014, and to prevent them in the future. But this also requires a clear understanding of the microstructure of trade and the robust patterns that exist in various stock exchanges.
Thus, using her theory, Anna Obizhaeva estimated that in December 2014, the Russian market could be crashed by a bid to buy foreign currency in the amount of about $7-9 billion purchased over the course of several days. Russian stock exchanges and the OTC market cannot provide such instant liquidity, resulting in a sharp rise in prices.
It could have been avoided if the market had been able to absorb the required amount of currency. It would probably have taken anything from a few weeks to one or two months. At the same time, traders had to break a large bid into many smaller ones and extend the currency purchase over time. In addition, the exchange rate change could have been less severe had the Moscow Exchange had well-established mechanisms to monitor trading processes in the foreign exchange market at that time, allowing for the temporary suspension of trade in cases of such a force majeure situation.
Of course, Anna Obizhaeva’s new article is most useful to those who trade on the US stock market, but it may also be of interest to those forming strategies for trading securities on the Moscow Stock Exchange or trying to find more efficient ways to manage big financial data. The presence of quantitative benchmarks allows traders to better understand the structure of markets and calibrate trade algorithms for different securities.
IQ