© ISTOCK
Last year, HSE Publishing House released The Russian Labour Market through the Prizm of Demography, a monograph edited by Vladimir Gimpelson and Rostislav Kapeliushnikov. IQ.HSE presents an abbreviated excerpt from this paper discussing the relationship between ageing and labour earnings, with reference to related theories and a snapshot of the current gender and age wage dynamics in Russia.
The starting point for the discussion is the extensive empirical evidence indicating that the age-wage curve tends to increase over time at a diminishing rate and to decline only at the end of one's working life, if at all.
This is how Jacob Mincer, one of the founders of the human capital theory, summarised this finding in the early 1970s: 'The basic features of the age profiles are easily summarised: except for the initial years of gainful activity, earnings are higher at higher levels of schooling, and increase with age through much of the working life. The absolute and, more consistently, relative rate of increase in annual earnings diminishes with age, becoming negative, if it changes at all during the last decade of working life. There is no visible decline at these later ages in weekly earnings'.
Fifteen years after Mincer's book, Robert M. Hutchens noted, ‘There is ample evidence that wages tend to rise with seniority in the firm in both union and non-union settings'. After 15 more years, Skirbekk confirmed, 'Earnings tend to increase until relatively late in the working life', but admitted, 'most evidence suggests that individuals’ job performance tends to increase in the first few years of one’s entry into the labour market, before it stabilises and often de- creases towards the end of one’s career'. According to Neumark, it is a well-established fact that wages tend to rise throughout most of one's working life. 'There seems to be little evidence that wages fall with age', notes Michal Myck.
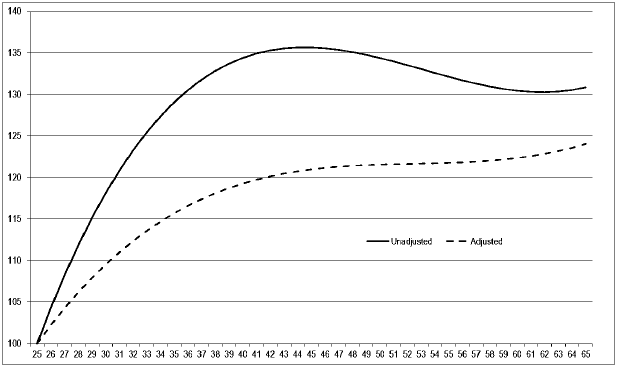
Despite some variations in age-wage profiles, the following graph from an OECD paper shows the overall trend for developed countries. The horizontal axis represents age (years), and the vertical axis represents hourly wages, including bonuses, with the wages of 25-year-olds set at 100%.
Age-wage profiles can vary depending on the type of data and earning interval (annual, weekly or hourly) used. For example, even at higher hourly rates, annual or monthly earnings can decrease with fewer hours worked.
The graph above represents averages for the OECD countries. The solid curve shows the age profile of hourly wages but does not reflect the diversity of these countries' workforce. Reaching its peak between the ages of 45 and 50, the curve then shows a gradual decline of some 5 percentage points over 20 years, mainly due to the local context in certain OECD countries.
The dashed line controls for heterogeneity of individual characteristics, taking into account the skills of adult workers (i. e. the quality of human capital), and therefore represents a more accurate picture of age-wage dynamics, indicating that hourly wages increase steadily with age. As noted above, this pattern is basically confirmed by numerous empirical studies carried out in various developed countries over the years, so we can conventionally regard it as 'standard'.
Studies attempting to explain this 'standard' are too numerous to even begin to count, let alone review, all of them. But it may be worth mentioning a few influential economic theories which do not challenge the observed empirical age-wage pattern but, rather, offer different explanations of this phenomenon.
Most prominently, the human capital theory explains the pattern of lifetime earnings by postulating a link between the accumulation of human capital such as hard and soft skills, on one hand, and increases in productivity over one's working life, on the other. Since wages must follow productivity, an increase in human capital leading to better productivity translates into a non-linear increase in earnings.
In this sense, the age-wage profile reflects the accumulation of human capital over the course of one's working life. Individual earnings start out low but as people invest in formal training and acquire hands-on experience, their earnings tend to increase rapidly. An individual's willingness to upgrade their knowledge and experience through continuous learning in the workplace determines the steepness of their age-wage curve.
Knowledge and skills first acquired in the formal education system can become outdated, diminishing the returns on human capital, and unless new investment is made, the age-wage curve will flatten out over time.
As people approach retirement age (and prepare to exit from the labour market), the duration of expected benefits from their investment shortens, and the 'wear and tear' of human capital accelerates. Thus, we can assume that earnings will tend to fall somewhat as individuals near retirement.
Lazear's theory of delayed payment contracts offers a different explanation of age-wage dynamics and also predicts a long period of growth in wages but without a decline in older ages. According to this theory, in order to discourage employee shirking and malfeasance when continuous supervision is impossible or impractical, employers offer compensation which is below the cost of a worker's efforts at early stages but increases to levels above the cost of labour for older workers.
This model shows how wages tend to monotonically increase over time but does not explain how the age-wage curve is shaped. It also assumes that a worker stays with the same employer, because their length of service-related benefits will zero out should they change employers. Mandatory retirement is also a must in this model to avoid an indefinite period of 'overpaying' a senior employee.
When a worker and an employer enter into a contract, they invest in adapting to each other. The quality of employer-employee matching is reflected in the length of employee service with the company. When the employer and employee part ways, both need to bear the cost of finding a new match, and this cost is higher for older employees for many reasons. First, switching employers can render irrelevant the worker's specific skills developed in their previous workplace. Second, the length of time when both parties expect to benefit from returns on their investment in matching and training is progressively shorter for older workers. And third, there are usually fewer vacancies for older job applicants.
Together, these factors serve as disincentives for older employees to change jobs and for employers to hire them. Older workers are thus discouraged from changing jobs and rarely benefit from an increase in productivity which can result from a better employer-employee match. Therefore, we can assume that the growth of their wages should slow down after a certain age, according to the search and matching theory.
Another proposed explanation is based on the hypothesis that most workers prefer monotonically increasing wages and are thus prepared to sacrifice part of their current wage to earn more in the future. Firms take this preference into account in drafting the employment contracts. No career-end decline in wages should be observed in this case, except if caused by complex interactions with the pension system.
Although the theories discussed above offer different interpretations of the age-wage curve, they all predict its monotonic growth (with some variations). Each of these theories makes assumptions concerning the behaviour of agents in the labour market: either a continuous investment in human capital (human capital theory) or specific employment contract arrangements (delayed payment contracts) or the costs of mobility (search and matching theory) or worker preferences (forced saving theory). No matter the underlying assumptions, remuneration is not supposed to decline within an effective employment contract.
But although the above assumptions reflect the labour market realities in developed countries, one can imagine a situation where none of these assumptions hold true.
In other words, a situation where investments in human capital fail to offset its depreciation even at early stages of a working career, workers are totally interchangeable, and labour contracts are designed to reflect only the current productivity.
This is the case, e. g. with the less popular but still common system of piece-rate wages or some other compensation arrangement linking pay to current performance. What age-wage profile could be expected in such circumstances? It would seem that a worker in a competitive labour market should be paid according to his or her performance, which should evolve as they age. If a digger is paid exactly in proportion to the amount of soil he can excavate during his working day (i. e. his current performance), which is easy to measure, his pay will depend on his physical strength and endurance. The skills required for this kind of work are easy to learn, and then the workers' performance will depend solely on his physical capacity, which will perhaps peak soon after the start of his working life and progressively decline due to age-associated loss of physical strength, endurance and health
The more jobs which do not require complex skills or continuous skills upgrade are available in an economy, the earlier individual earnings will peak, followed by a plateau or a downward trend. Obviously, the proportion of jobs where little initial training is required, continuing professional development is limited or non-existent and wages are less rigid tends to be much higher in less developed economies.
In contrast, developed economies tend to have a relatively high proportion of technologically advanced jobs, where the evolving technology requires continuous additional training and re-training, i. e. consistent investment in human capital with implications for age-wage profiles.
Where does Russia stand in this regard?
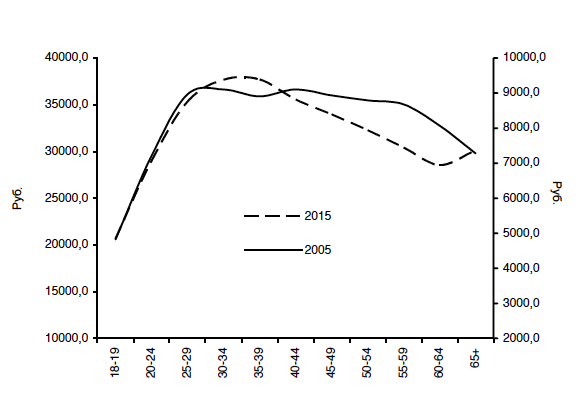
The figure above shows two age profiles for the average nominal wage of Russian workers based on HPM data for 2005 and 2015. The left vertical axis corresponds to the 2005 curve, and the right axis to the 2015 curve. Wages are calculated based on consumer prices in the respective years.
This survey, carried out by Rosstat once every other October since 2005, is based on an extensive sample of more than 700,000 observations. Its additional advantage is that the wages are determined based on employer financial statements rather than self-reported by respondents (who can misquote the amount by mistake or intentionally). The sample includes workers who have worked a full month to offset the effect of hours worked.
In both cases (2005 and 2015), earnings peaked in the 30–34 age group. Before this age, i. e. at early career stages, the profiles show similar steepness: the average salary in the 30–34-year-old group is 30% higher than that in the 20–24-year-old group. Starting from the ages of 40–44, both samples show a decline but at different rates: it was significantly steeper in 2015 than in 2005.
In 2005, the average wage of 50–54-year-olds stood at about 8 percentage points below the peak, while in 2015, the difference was 20 percentage points. Compared to other (developed) countries, the difference is obvious: apparently, the average wage in Russia begins to decline at a fast pace long before an individual reaches pre-retirement age.
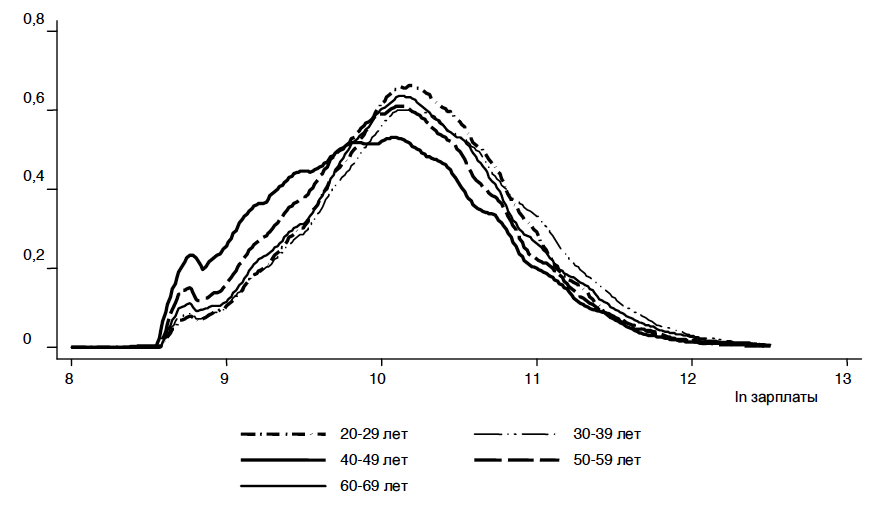
Not only the wage averages, but other parameters of the wage distribution vary as well. The Kernel plot of the logarithm of wages for 10-year age groups presented in the figure above illustrates how the entire wage distribution shifts to the left, i. e. towards lower values, starting from a certain age.
A noticeable increase in the number of older workers with wages slightly higher than the current minimum wage (its logarithm being about 8.6 on the horizontal scale as of October 2015) also contributes to the decrease in average values, which can be seen in the group of workers in their 50s and particularly in the over-60 group.
However, the above conclusion about an early peak and a subsequent decline is based on age group averages and does not take into account a number of other variables, such as sectoral differences. Some sectors, e. g. the ICT, tend to employ younger people, while public service employees are older on average.
In addition to this, different jobs and sectors can have different age and wage structures. The same applies to other variables correlated with age, such as education or occupation. Second, there is a bias arising from self-selection into employment, when less educated or less motivated workers leave the labour market earlier and thus do not contribute to the average wage in older age groups, which would have been even lower if they had stayed employed in low-paid jobs. And third, the above graph is a snapshot that does not take into account how earnings change over time within age cohorts.
The question is whether the resulting profiles can be reproduced using alternative Russian data.
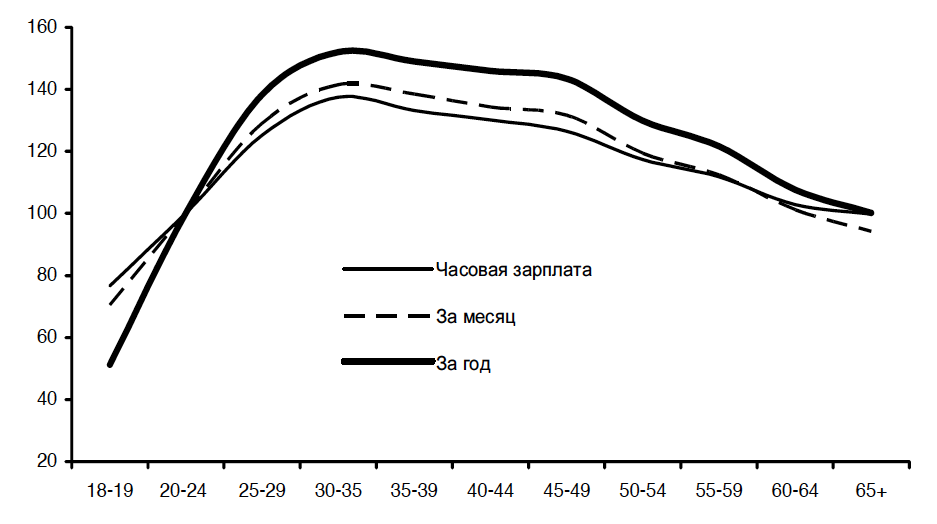
As part of its Selective Observation of Population Income and Participation in Social Programmes (VNDN), Rosstat surveys 160,000 Russian households whose members are employed across all economic sectors. This data enables an estimation of the total flow of earnings in 2015, alongside average monthly wages and hourly rates, making this source particularly useful, as these three parameters can vary significantly across age groups. In the graph below, all three metrics follow roughly the same pattern as the HPM data discussed above.
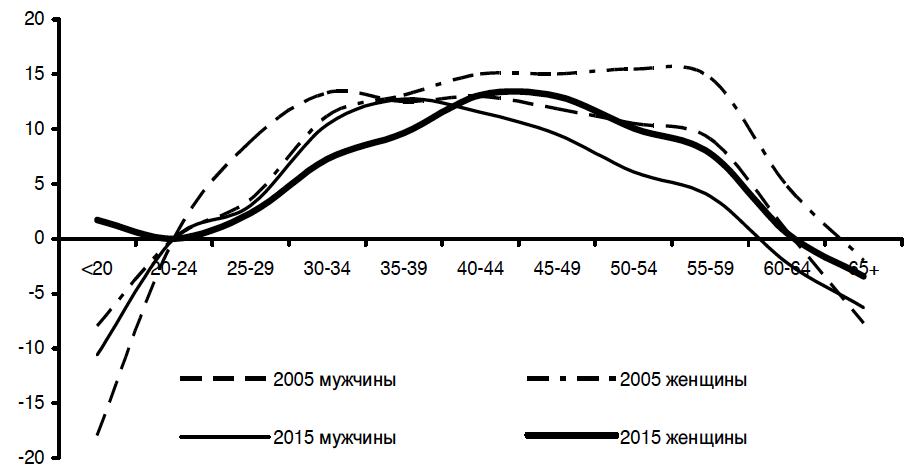
To minimise the impact of structural differences on wages, one needs to compare age groups with a similar labour force structure. This can be done via a simple regression analysis using a version of the Mincer Wage Equation with a flexible age specification, separately for men and women. This exercise uses the same HPM data for 2005 and 2015 as above. The following figure shows age-specific wage profiles. The vertical axis shows the percentage change in wages for different age groups compared to the reference group (20-24-year-olds).
This graph reveals a more complex picture. The dash-dotted and bold lines show the 2005 and 2015 wage profiles for women, respectively, and the dashed and thin lines show the 2005 and 2015 wage profiles for men, respectively. A visual comparison with the profile shown in the first graph reveals the main difference: an extended almost horizontal plateau between the ages of 40 and 65 in OECD countries and a rapid decline in wage premiums in the same age range in Russia. However, the age premiums during the 15-20 years of working life up to the age of 40 are similar between OECD countries and Russia. Men's and women's age-wage profiles differed substantially in 2005 but converged over time.
In 2005, men aged between 30 and 34 were paid 22% more than the 20–24-year-old reference group, and later on their wages plateaued until the ages of 50–54 and rapidly declined afterwards. Men who remained employed after 65 earned the same amount as those just starting their working life at 20-24.
But men's wage-age profiles looked different in 2015. By the age of 30–34, they earned 16% more than those aged 20–24, reaching their peak earnings at 21% higher than in the reference group by 35-39 (i. e. the range of variations was the same as in 2005). Then the age premium gradually decreased to zero by the retirement age. In other words, the relative peak remained the same but moved forward five years, followed by a rapid decline instead of a plateau.
Women's age-wage profile was somewhat different: almost standard in 2005, when women's wages monotonically increased until the pre-retirement age of 50–54. The peak earnings exceeded those at the starting point by 28% in 2005, but the excess dropped to 20% by 2015, while the time needed to reach the peak shortened by 10 years between 2005 and 2015 (from 30-34 to 40-44 years old). A rapid decline, rather than a plateau, is observed both in 2005 and 2015.
The main conclusion this analysis highlights is that between 2005 to 2015, the age-wage profiles in Russia did not only remain 'substandard' compared to developed economies but evolved further in this direction. Controlling for other factors makes the age-wage curves even steeper.
Assuming, in line with the human capital theory, that the age-wage profiles reflect the knowledge and skills accumulated by individuals during their working life, such profiles must vary across groups depending on their education and occupation. Different occupations make different demands on human capital and contribute to its reproduction in different ways, and this is reflected in the age-wage profile, as seen from the available data.
Although in some occupations and types of activity the age of reaching the wage peak has shifted to the right (compared to that observed on previous graphs), it is still followed by a significant decline. A monotonic increase in earnings throughout the working life is not observed in any of the groups categorised by education or occupation.
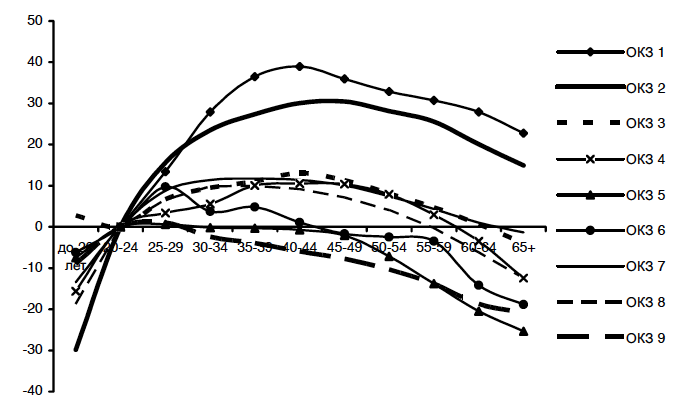
The first graph shows the respective profiles based on the level of educational attainment, and the second graph shows occupation-based profiles. All estimates are obtained from Mincer equations, controlled for key individual characteristics.
The lower one's level of education, the earlier the peak is reached and the flatter the profile. Those with higher education reach the peak wage exceeding that of the reference age group by 50% at age 40-44, and by the end of their careers, their earnings decline to just 20% above the starting point, which is a 30 pp. decrease from the maximum. In all groups with lower levels of education, the dynamics are more sluggish, with the peak exceeding the starting point by 10% and a subsequent decline by some 20 pp. Indeed, when there is something to lose (i. e. an education which can become outdated or irrelevant), losses can be greater than if there is not much to lose.
Interestingly, all curves representing below-higher education profiles almost merge, showing little differentiation. This is consistent with other findings from Russian studies suggesting that only a higher education comes with a significant wage premium.
Age-wage profiles by occupational group show a similar picture (aggregation at the one-digit level of the OKZ – Russian Classifier of Occupations/ISCO Classifier). There are two major groups in the classification which usually require higher education and involve more sophisticated job responsibilities and decision-making powers: managers (OKZ-1) and professionals (OKZ-2). Their profiles tend to be steeper and peak later in the career than those of other occupations.
All other occupations follow a pattern where a sluggish growth of the age premium continues until it reaches a peak of 10% and then falls by 10%–20%. Hardly any age-related growth of wages is observed in the groups OKZ-5 (workers in the services sector, housing and utilities sector, and sales) and OKZ-9 (elementary occupations), and older workers in these jobs tend to be paid about 20% less than the starting wage. The group OKZ-6 (agricultural workers) sees a slight increase in wages at first, but then the age premium disappears and turns into a penalty.
Assuming that age-wage profiles reflect the accumulation and use of human capital, we must admit that for many (or most?) occupations, these processes are sluggish and end early in one's working life. It is not surprising that jobs which are routine and require only elementary skills which are acquired early on allow little room for continuous learning.
The more rudimentary a worker's job functions, the less they are connected with those of other workers within a single technological process, the easier it usually is to assess individual productivity and the more precisely it can be approximated by wages.
IQ
Authors of the monograph:
Vishnevskaya N. T., Gimpelson V.E., Denisova I.A., Zudina A.A., Kapeliushnikov R.I., Lukyanova A.L., Oschepkov A.Yu., Travkin P. V., Chernina Ye.M., Sharunina A.V.